Litecoin price analysis for today shows that the market condition is bearish. The price opened at $89.65 and is currently trading at $88.02, showing a decline of 0.44%. Bulls were in control of the market earlier today, pushing the price up to $89.65 levels, but failed to sustain the momentum and eventually pulled back. The resistance level is at $89.66, and support was unable to push the price up. As a result, the market is in the red. The trading volume has been decreasing over the past few hours and currently stands at $425 million while the market capitalization is trading at $6.3 billion.
Litecoin price analysis on 1-day chart: LTC/USD Consolidates at $88.02 As It Corrects Slowly
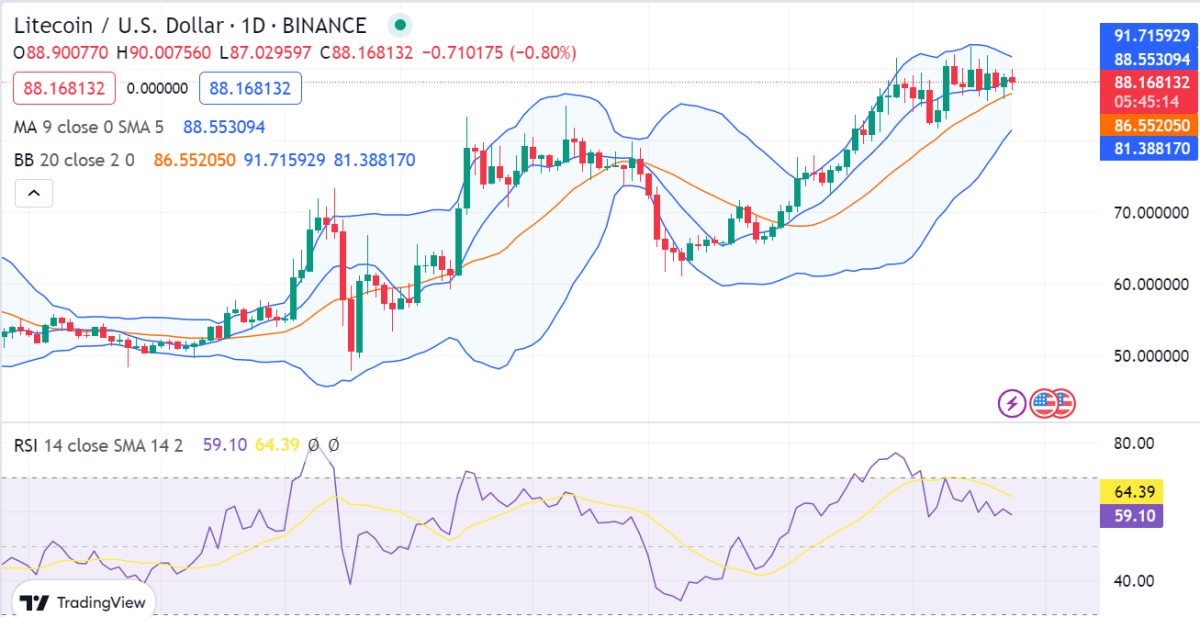
The one-day Litecoin price analysis also shows that the bearish momentum has been continuing over the past few days, and today, the trend is the same. The price has been lowered to the $88.02 level after the latest drop. The crypto pair has been at a loss of 0.44 percent for the last few hours. The Litecoin value has somewhat declined over the last couple of hours; at the time of writing, it is $88.02 and is now appearing to be declining.


The relative strength index (RSI) is currently at 64.39, which indicates that there could be further downside pressure on the market. Looking ahead, the moving average indicator is showing a bearish crossover and suggests that the market could move further downward in the short term. The Bollinger Bands are increasing, suggesting that further downtrends are taking place as the volatility increases. The upper band of the Bollinger Bands indicator is touching the $91.712 point, whereas their lower band is present at an $81.388 margin
LTC/USD 4-hour price chart: Bearish signal escalates
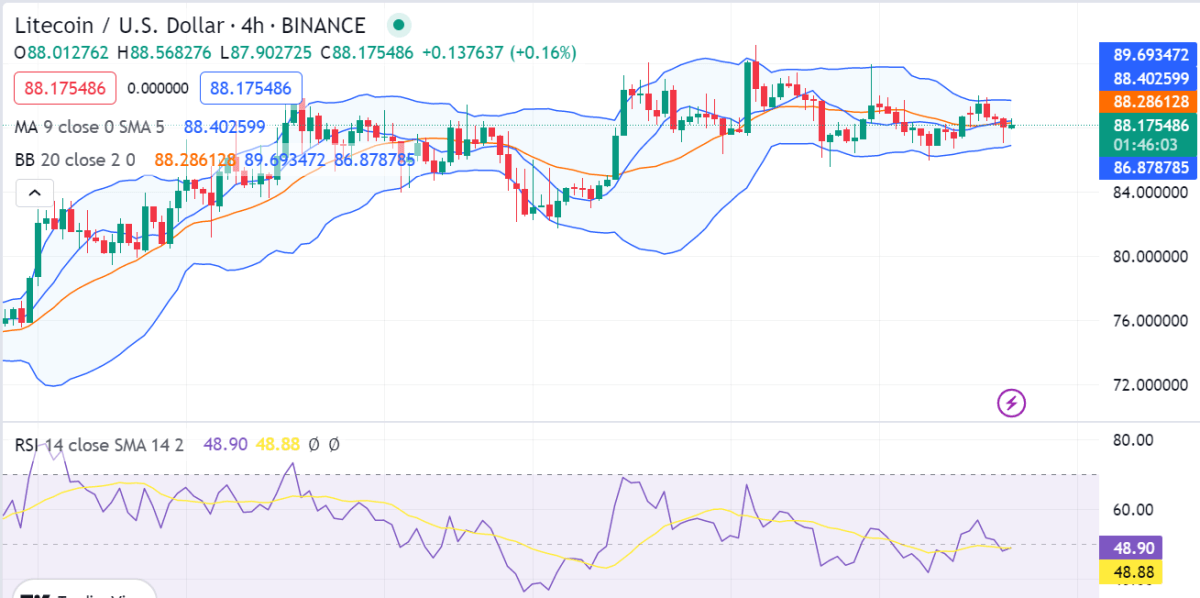
The 4-hour Litecoin price analysis indicates a further decrease in prices, which have devalued to $88.02 at the time of writing. The market volatility follows a declining trend, resulting in the cryptocurrency being less susceptible to volatile change on either extreme. The Bollinger band average is now at $6.25, whereas the upper Bollinger Bands value is at $89.6934, and the lower Bollinger Bands value is at the $86.878 position.


The MA 50 and the MA 200 are both bearish, as they are both below the current market price. This indicates that the bears are in control of the market. The relative strength index (RSI) is currently at 48.88, which suggests that the market is not oversold and could potentially move further downward.
Litecoin price analysis conclusion
In conclusion, Litecoin’s price analysis shows that the bears are in control of the market and that the price is likely to move further downward in the short term. The volatility is increasing, suggesting more downside potential. The Litecoin price has fallen to $88.02, and it looks like it will go further down if the bearish pressure persists. But bullish investors may also take advantage of the current market conditions and purchase LTC at a lower price than usual.


