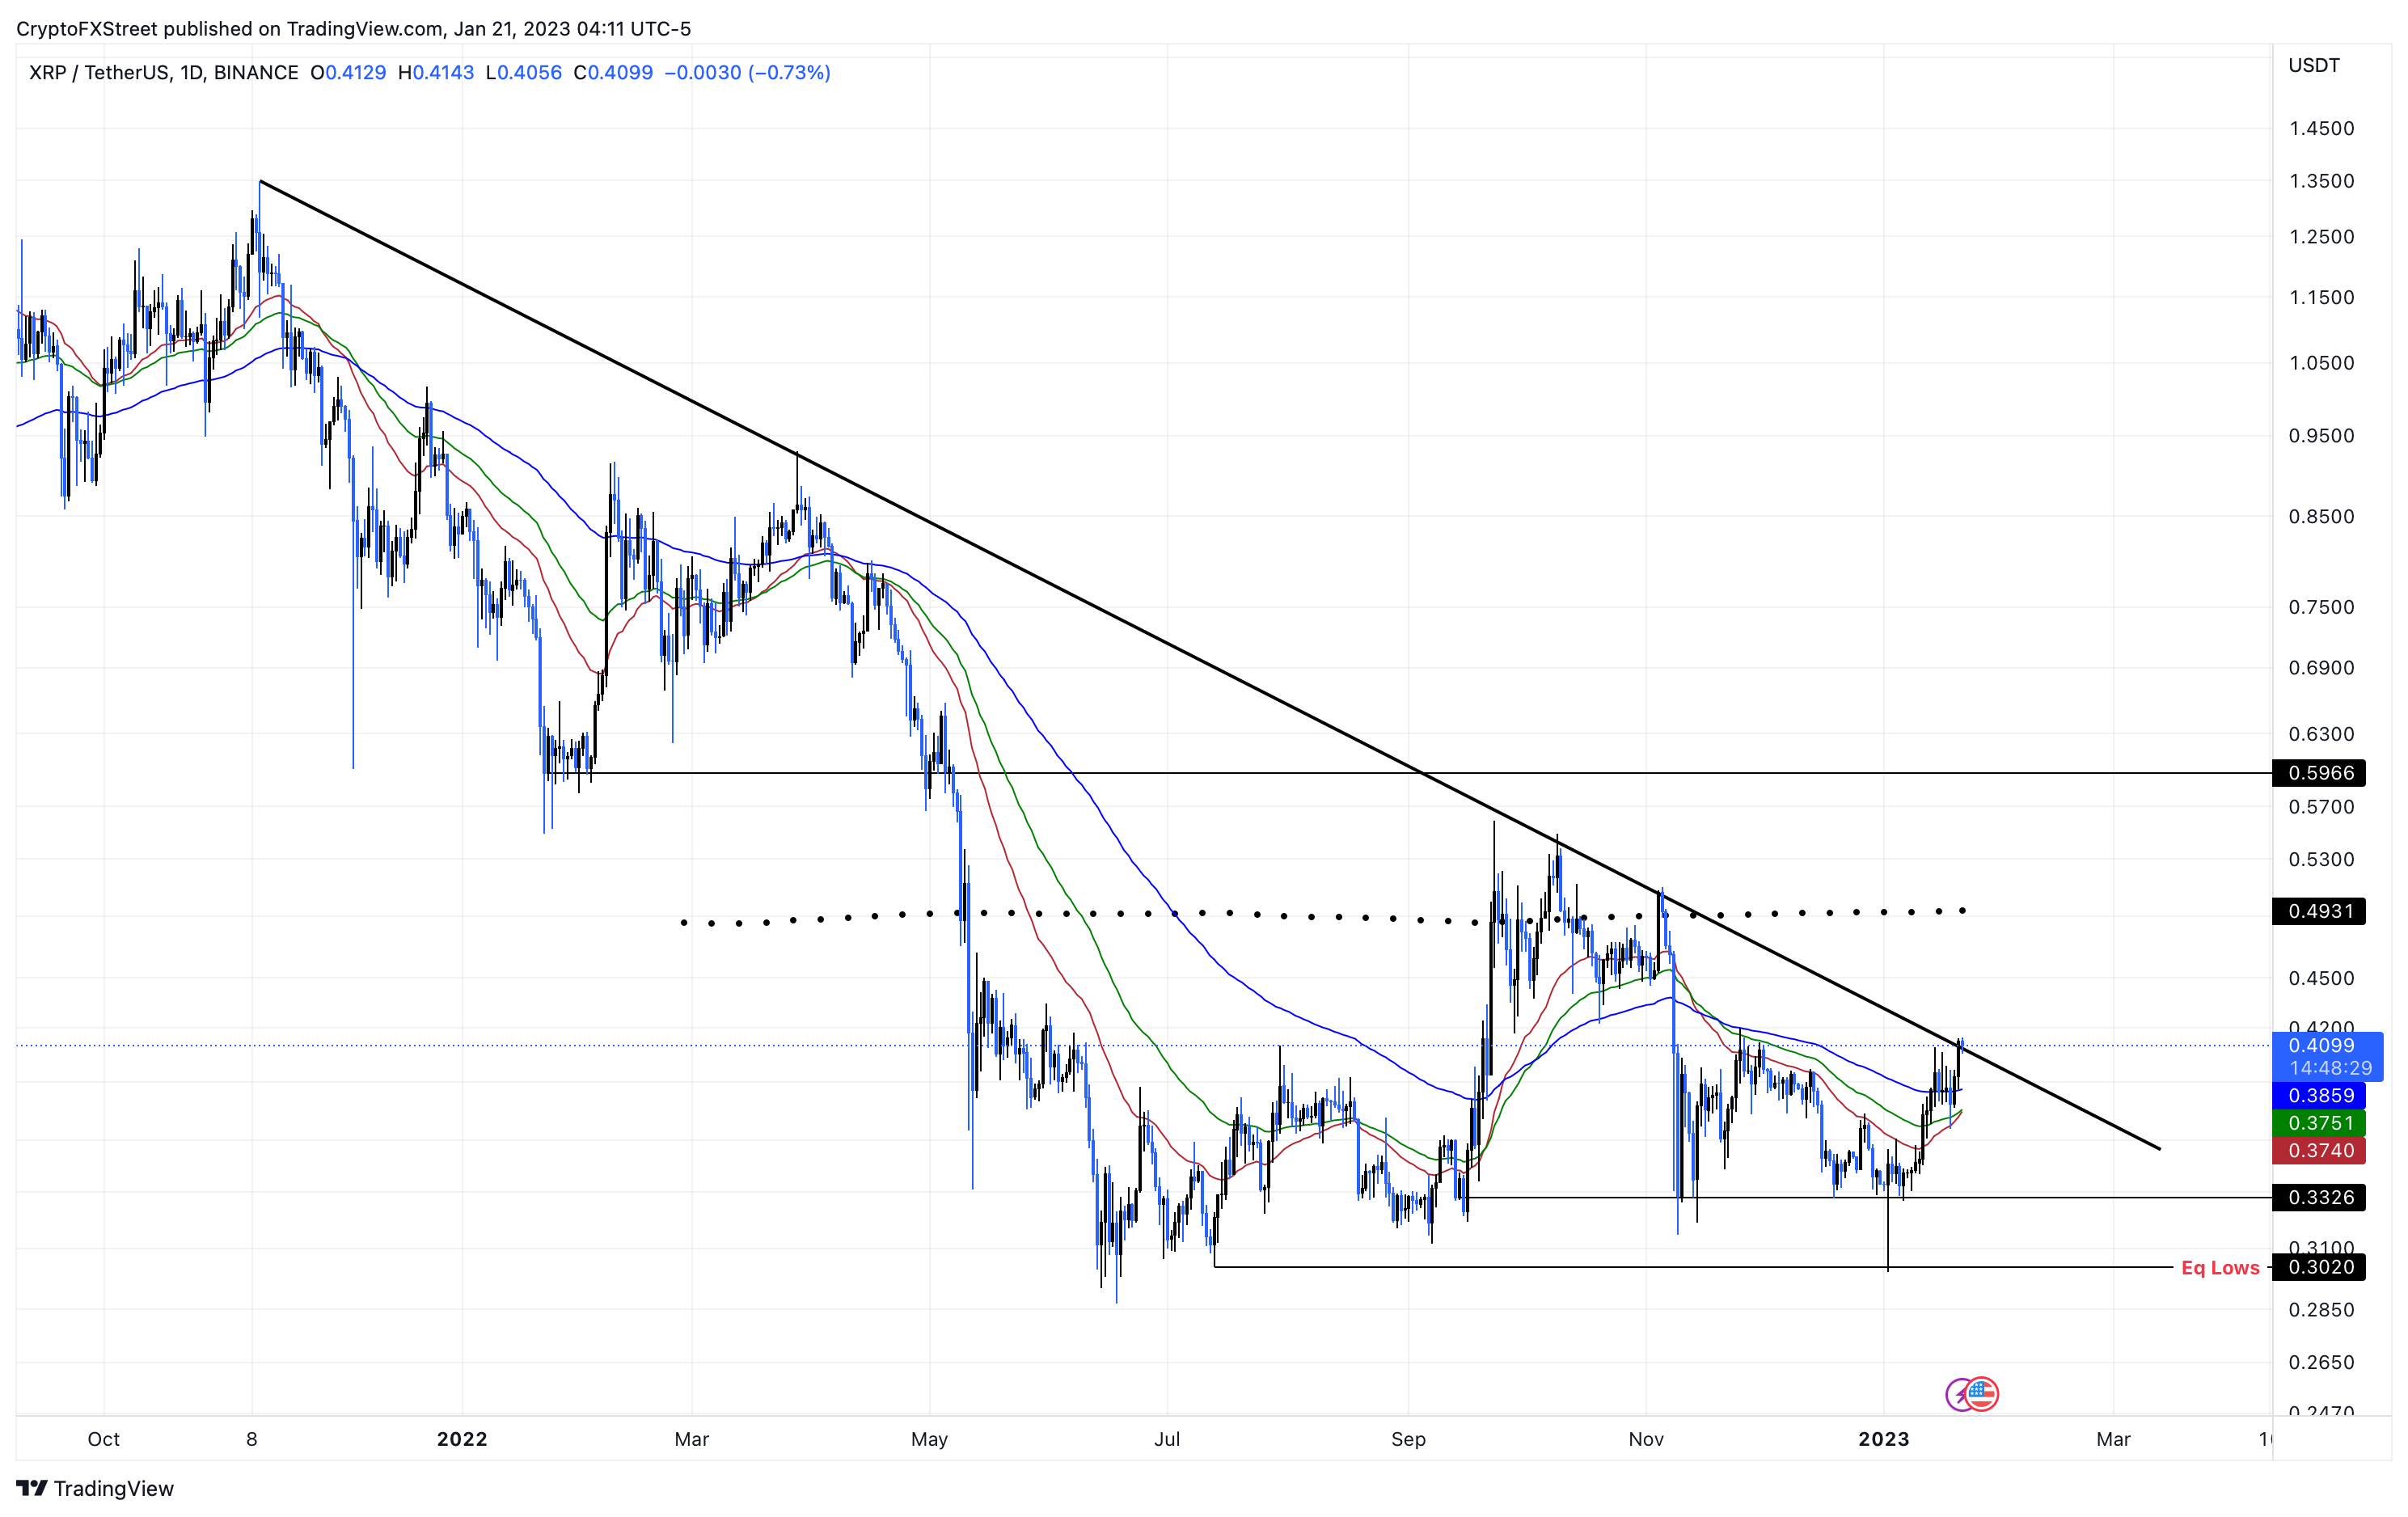
- XRP price is knocking on a multi-year declining trend line, hinting an explosive breakout if its breached.
- Investors can expect a 20% upswing to tag the 200-week SMA at $0.493.
- Invalidation of the bullish thesis will occur if Ripple slides below the EMA confluence at $0.374.
XRP price shows that it is approaching a crucial resistance level, a breakout above this level will trigger an explosive move. Ripple bulls need to be extremely cautious as to not get trapped if there is a sudden sell-off delaying the breakout.
XRP price at an important level
XRP price has been stuck in a downtrend, producing six lower highs since November 2021. A trend line connecting these swing points reveals a declining resistance level. Although Ripple buls have produced a daily candlestick close above this level, it is not confirmed yet.
A swift move above this level followed by a retest that holds will confirm that the bulls are here to stay. Looking at the recent price action confirms that there is interest in the remittance token as it has sliced through the 30-day, 50-day and 100-day Exponential Moving Averages (EMAs). Additionally, a retest of these EMAs confirmed there is a buyer interest.
Going forward, a breakout of from this mult-year declining trend line will allow XRP price to rally 20% to tag the next hurdle which is the 200-day Simple Moving Average (SMA) at $0.493. Beyond this level, Ripple bulls could further ascend to retest the $0.596, bringing the total rally to 45%.

XRP/USDT 1-day chart
While things are looking good, XRP price could get rejected at the declining trend line, delaying the breakout. In such a case, Ripple will find support at roughly $0.374, which is the confluence of 30-day, 50-day and 100-day EMAs.
However, a daily candlestick close that flips the aforementioned level into a resistance barrier will invalidate the bullish thesis. In such a case, XRP price could slide 11% and tag the $0.332 support level.


