- Bitcoin price rises by 6% into the mid $22,000.
- Ethereum price shows potential to rally back to $2,000.
- XRP price is setting up a rally to $0.44 for a 10% gain.
The crypto market makes a move to the upside, confirming last week’s bullish trend will continue. Key levels have been defined to assess where the bulls may be aiming for
Bitcoin price proves the skeptics wrong
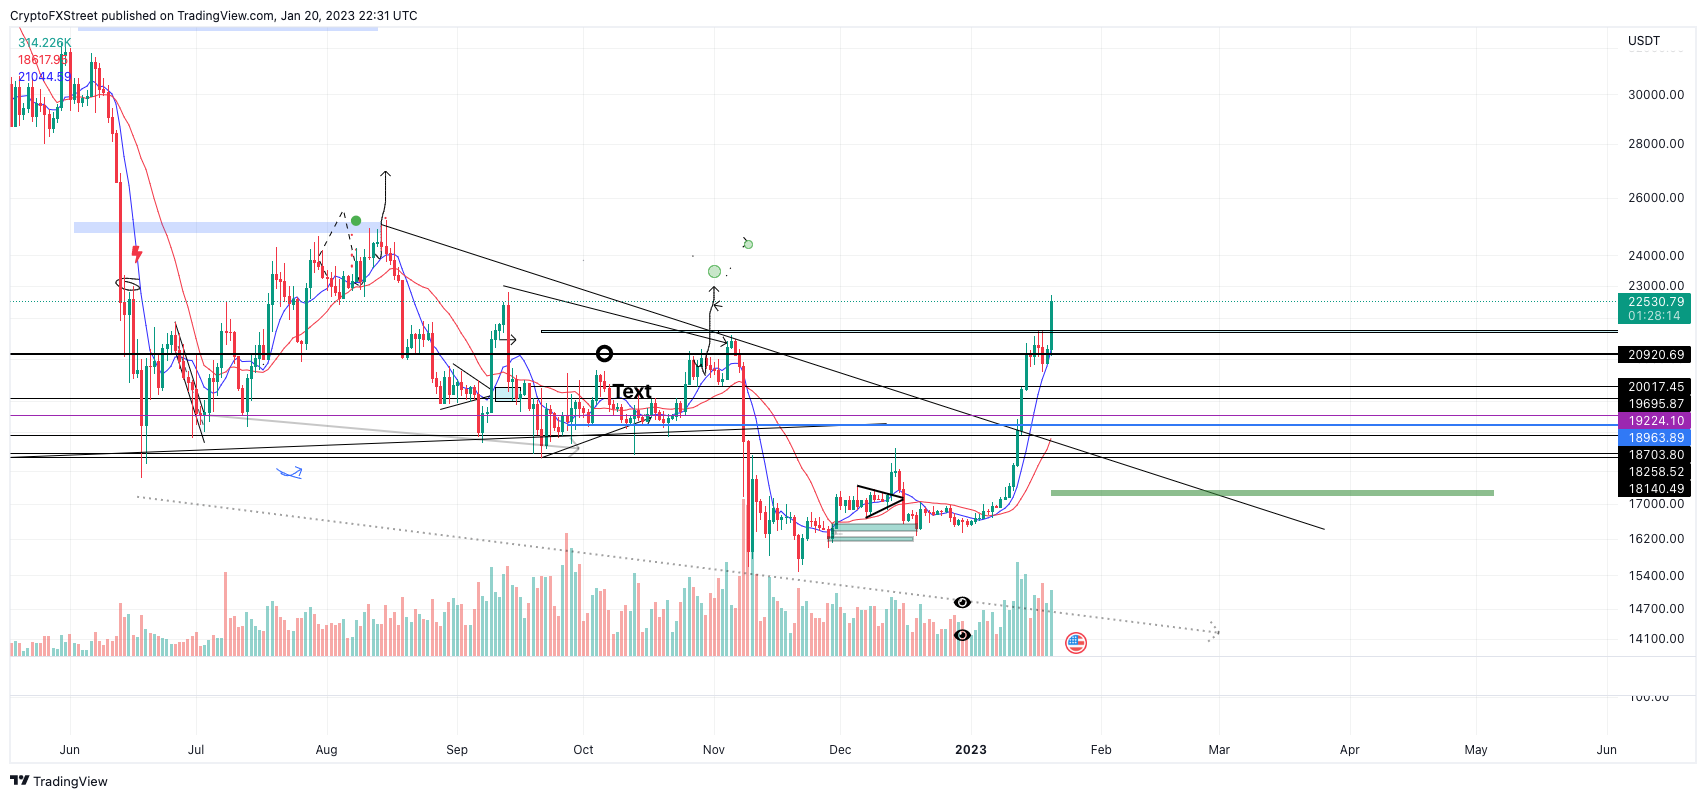
Bitcoin price continues to prove the skeptics wrong as the uptrend rally established at the beginning of the month has shown its first signs of continuation. On Friday, January 20, the peer-to-peer digital currency is up 5% on the day, blowing past November’s monthly high at $21,480. As the price ascends, the only thing for traders to do now is ride the trend and consider where profit will be taken along the way.
Bitcoin price currently auctions at $22,487. The recent surge was catalyzed after a brief stop near the psychological $20,000 level. The 8-day exponential average jumped in and provided the support needed to prompt the ongoing move. Previous outlooks mentioned that Bitcoin could be rallying towards the origin point of the descending trend line from it has broken out from. The surge is surely convincing of the early-month forecast and provokes a potential 12% gain from the current price point toward $25,211.
BTC/USDT 1-Day Chart
Invalidation of the uptrend move could occur If the bears can tag the swing point at $18,887. A breach of the Pivot Point would invalidate the impulsive structure that Bitcoin currently has and could create a sweep the lows event in the process targeting the 2022 low at $15,476.
Ethereum price aims for $2,000
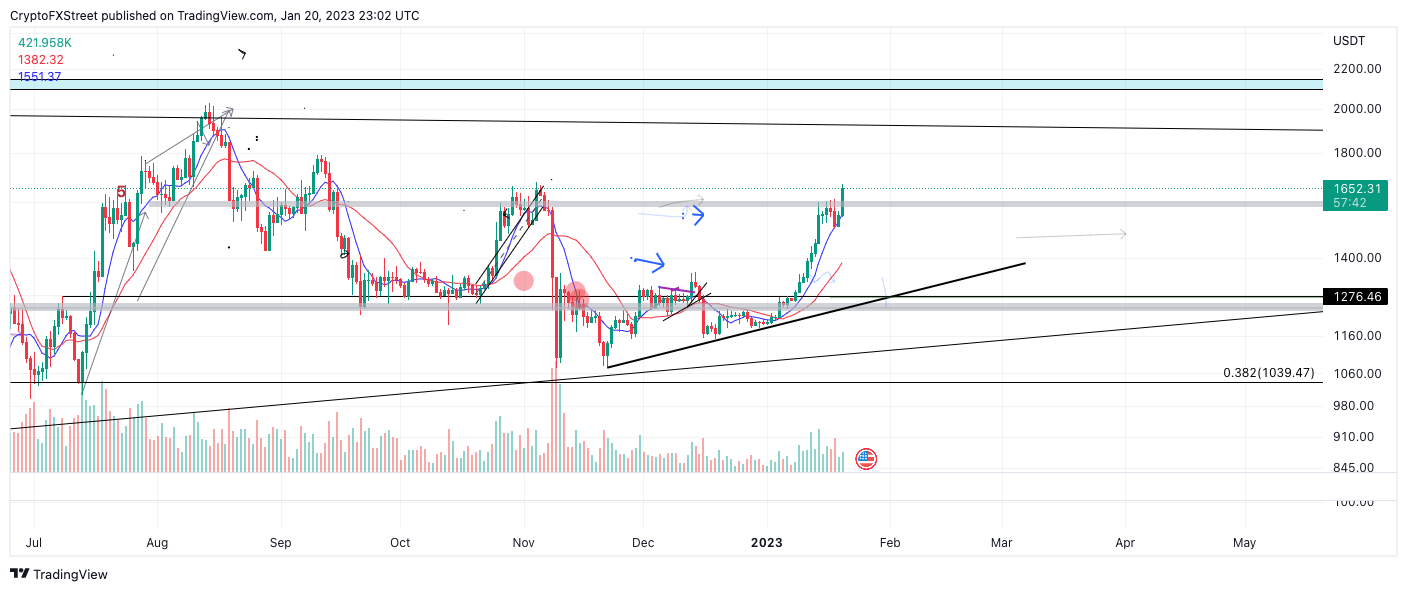
Ethereum price currently trades at $1,651, as the bulls have matched Bitcoin’s rally with a 6% spike of their own. The Ethereum price now has two more liquidity levels in its’ trajectory to challenge before ultimately re-acquainting with the psychological $2,000 level.
The first bullish target zone is the September 12 swing high at $1,789. The second target would be a broken support zone at $1,850. The aforementioned level lost support during the last week of August and has yet to be retested. The bullish scenario creates room for a 10% rally from the current Ethereum price.
ETH/USDT 1-Day Chart
Now that price is moving higher, invalidation of the uptrend could be placed at the $1,350 pivot point. If the level is tagged, investors could expect deeper correction underway, ultimately testing the ascending trend line near $1,280. The trend has been crucial throughout the early stages of the current uptrend rally, as it provided support on multiple occasions throughout the fall and winter.
XRP price breaks out
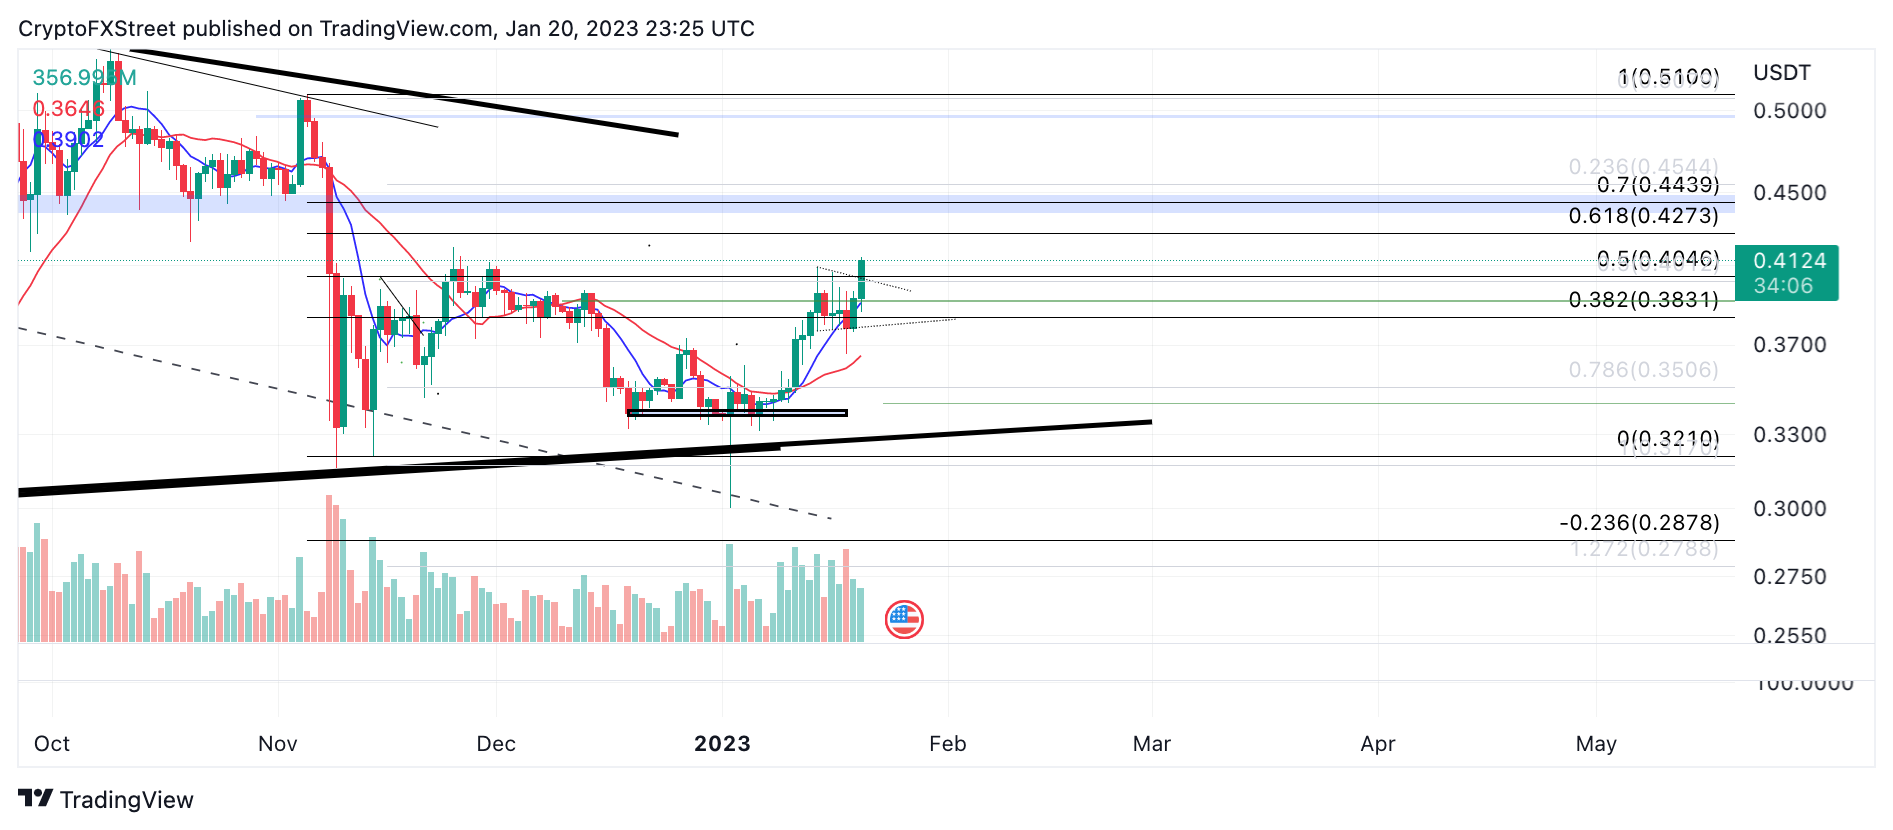
XRP price has broken out of a 5-day consolidation to the upside and shows potential for a rally into the mid $0.40 zone. On January 20, the bulls confirmed that the uptrend established earlier in the month is likely to continue, provoking a 5% rally in less than 24 hours.
XRP price currently auctions at $0.41. A Fibonacci retracement tool surrounding November’s swing high at $0.51 and the November low at $0.32 shows the 5% move hurdling above the 50% fib level. This is a subtle gesture of “rights-to-passage,” which means the Rpleip price could rally to the 61.8% level at $0.427. A broken support zone is also lying at $0.44, which remains untested since the bears breached the barrier in November. A tag of the liquidity zone would result in a 10% increase from the current XRP price.
XRP/USDT 1-Day Chart
Invalidation of the uptrend can now be placed at the broken consolidation’s swing slow near $0.365. A breach of the low could induce a steeper decline targeting the $ 0.34 support level. The XRP price would decline by 16% if the bears were to succeed.


