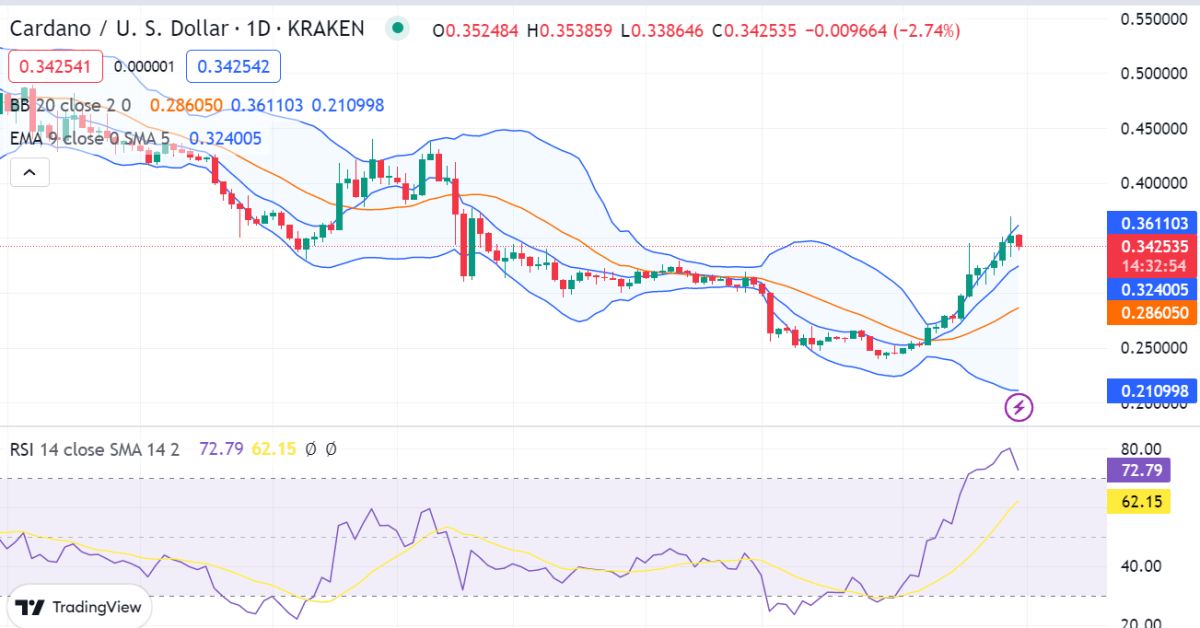
Cardano price analysis for today shows that ADA/USD has crashed to $0.3437 after a strong bearish period. The price has been volatile over the past few days but is now down 6.25% from highs of $0.3314 seen earlier this week. Technical analysis suggests that the price could continue to decline in the near future. If the bears keep pressure on the market, ADA/USD might move toward $0.3430, while the bulls try to push the market higher, Cardano‘s price could move toward $0.3440. The ADA token has found some support at $0.3431, while resistance was identified at $0.3685.
Cardano Price Analysis 1-day chart: ADA/USD enters bearish movement at $0.3437
The one-day Cardano price analysis shows that the ADA/USD pair is displaying a bearish trend for today because the price also dropped today. Over the past 24 hours, the bearish momentum has persisted. After the most recent decrease, the price has dropped to $ 0.3437. For the past few hours, the cryptocurrency pair has lost 6.25 percent of its value. The market’s volatility is following a decreased movement. This indicates that the price of Cardano is continuing to decrease dynamically and is becoming less susceptible to the movement towards either extreme.


The Bollinger bands values in the 1-day price chart are as follows; the upper Bollinger band is at $0.361103, whereas the lower Bollinger band is at $0.210998, respectively. The EMA for Cardano is currently at $0.324005 and is heading towards the EMA 50 which is at $0.25000, while the EMA 200 is far away at $0.286050. Moreover, the Relative Strength Index (RSI) for Cardano is currently at 62.15 and shows that the market is currently in oversold territory.
ADA/USD 4-hour price chart: Bearish spell drags price to $0.3437
The 4-hour price chart for Cardano indicates that the coin has been on a bearish trend over the past 24 hours, despite the bulls’ best efforts to drive the market upward and the bears’ ongoing pressure on the market as they push prices below $0,3437. Therefore, the 24-hour trading volume has also declined and is currently at $521 million, while the market capitalization for ADA/USD pair is trading at $11.7 billion.


The Relative Strength Index (RSI) is present at 67.28 in the neutral region, indicating unfavorable circumstances for the ADA, as the downward curve of the indicator shows the selling activity in the market, which is depreciating its value. The Exponential Moving Average for Cardano on the 4-hour timeframe is currently at $0.342535, which is confirming a major bearish pressure on price movement. The Bollinger Bands indicator average has decreased to $0.339465, whereas the upper Bollinger band is showing a $0.363822 reading and the lower band is showing a $0.315108 reading, representing a high volatility range for the ADA.
Cardano price analysis conclusion
In conclusion, Cardano Price Analysis reveals that for the previous two days, the coin has been in a bearish trend. Given that the technical indications are primarily bearish, the market may experience some selling pressure in the near term. Currently, in a phase of consolidation, the market may find direction if it breaks out above either $0.3685 or $0.3431.


