- LTC’s bears had leverage in the market.
- Its price could drop below $64.67.
- A move beyond $68.35 would invalidate the forecast.
Litecoin (LTC) has faced several price rejections at the $80.24 level since late November. In particular, the $76.72 level saw the highest traded volumes, as indicated by the Volume Profile Visible Range (VPVR) indicator.
At the time of publication, LTC had fallen way below this price rejection threshold but found new steady support at $63.48.
LTC broke below $66.40 after BTC dropped below $16.82k. At press time, the asset was trading at $66.05 and in a mild uptrend due to intense opposition from selling pressure.
If the selling pressure increases, LTC could retest or break below the current support level at $63.48.
Read Litecoin (LTC) price prediction 2023-24
LTC bulls nightmare: Will the uptrend continue?
Technical indicators suggested a mild uptrend, given sellers’ leverage in the market. The Relative Strength Index (RSI) made a smooth inclination toward the neutral level of 50. It showed the buying pressure and accumulation had increased, but selling pressure couldn’t be ignored.
In addition, the On Balance Volume (OBV) made recent higher lows, showing trading volume increased slightly in the past few days, boosting the buying pressure and uptrend momentum. However, OBV needed to reach the definitive level of 20m to give bulls leverage.
Moreover, the Directional Movement Index (DMI) showed sellers had the upper hand, despite a steady decline recently.
Therefore, LTC could drop below $64.67 and slide into the buy zone (green area). Any additional drop, especially if BTC is bearish, could see LTC find new support at $61.15. It can serve as a short-selling target but doesn’t offer an excellent risk-to-reward ratio (RR).
A move beyond the 50-EMA (Exponential Moving Average) level of $68.35 will give the bulls little leverage, invalidating the above bearish forecast. Such a move could allow investors who bought LTC at discounted prices to wait for a sell-off at $76.72 to lock in gains.
How many Litecoins (LTC) can you get for $1?
Short and long-term LTC investors suffered over 5% in losses
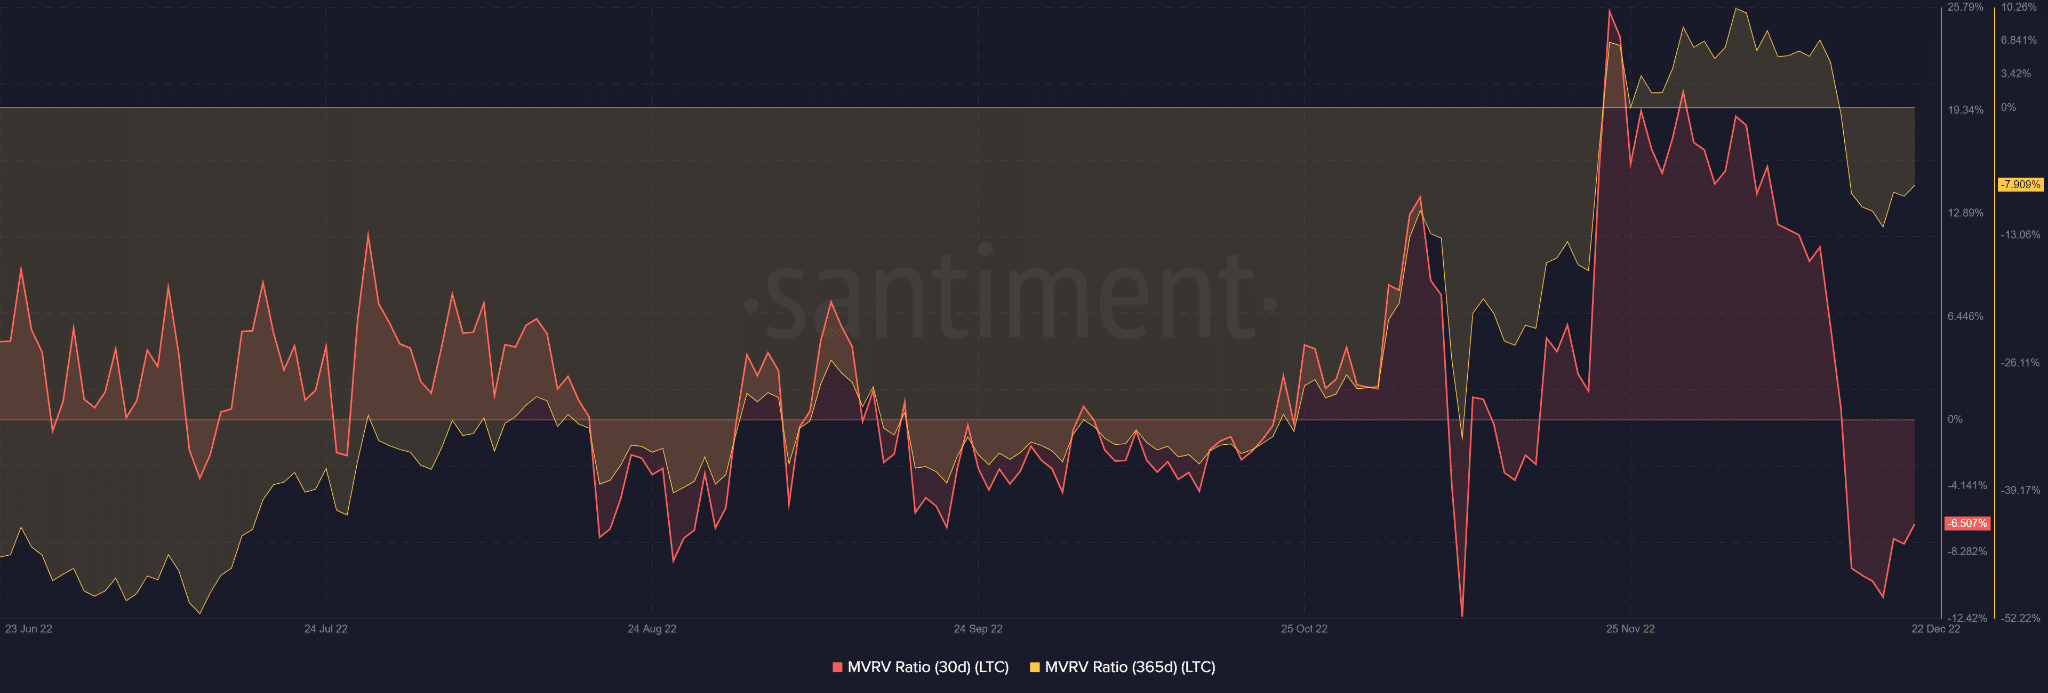
According to Santiment, the MVRV (market value to realized value) ratio for both monthly (30-day) and annual (365-day) periods was in the negative zone. The yearly losses stood at 7.9%, while monthly losses were at 6.5%.
Therefore, short and long-term LTC holders didn’t make any gains since 15 December. Nevertheless, the losses eased slightly as the MVRVs pulled back from the deeper negative area.
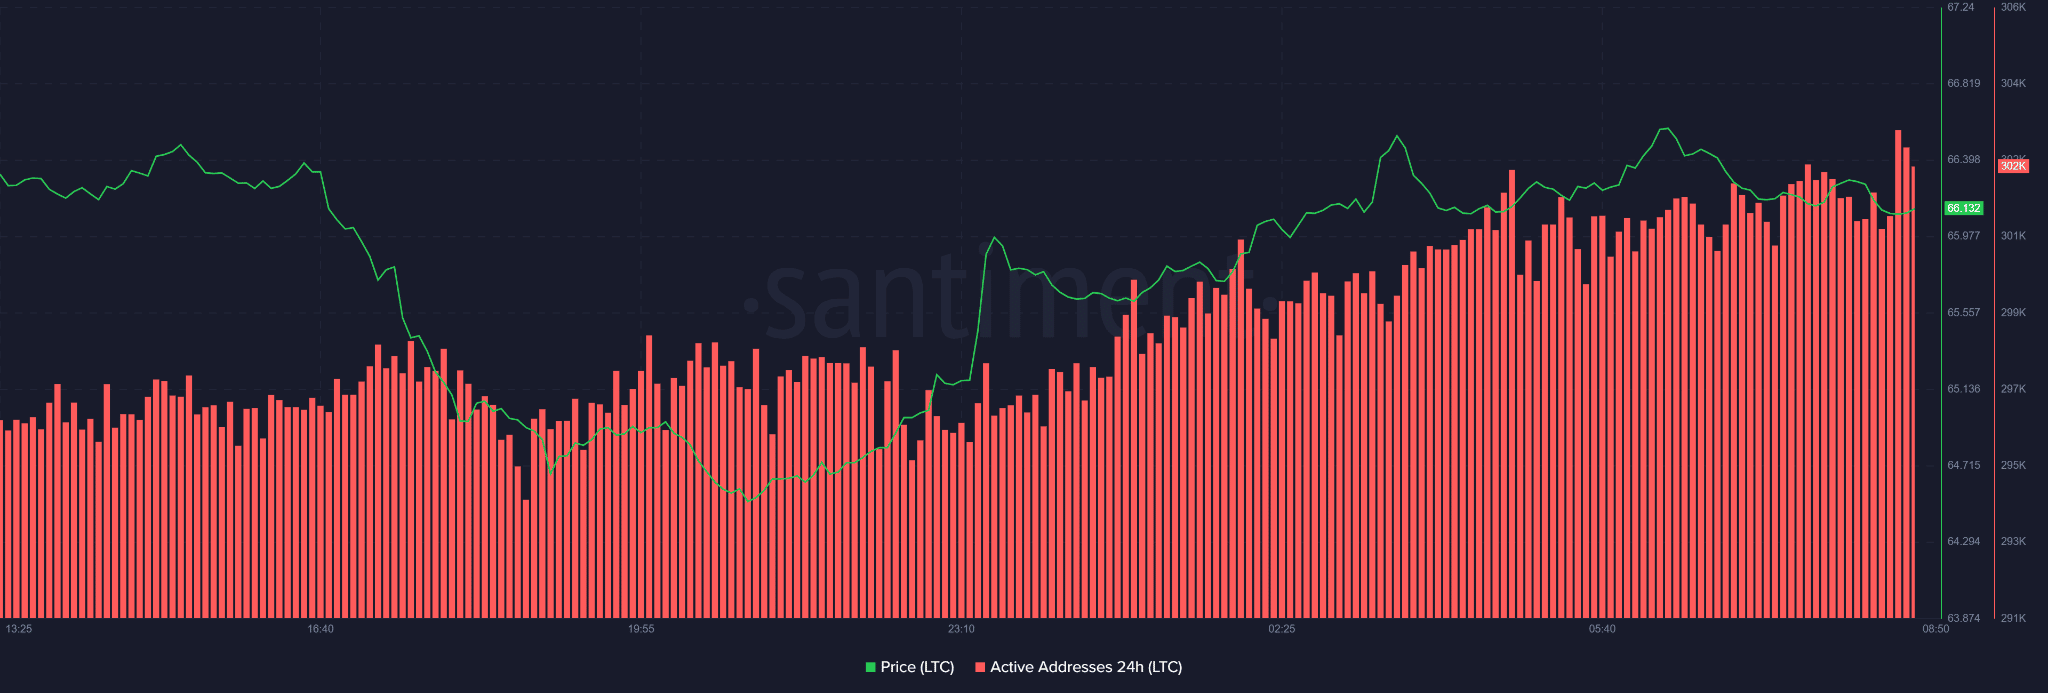
In addition, the number of active addresses in the last 24 hours showed a steady increase, indicating that accounts trading LTC went up with increasing prices.
If the trend continues, selling pressure could be subdued, allowing bulls to push the uptrend momentum. Such an uptrend, especially with a bullish BTC, will invalidate the bearish bias above.
![Long-term Litecoin [LTC] investors can profit from these levels if BTC…](http://egrowonline.com/wp-content/uploads/2022/12/michael-fortsch-fYSVVQqiqPs-unsplash-1-1000x600-360x180.jpg)


