Ethereum price analysis indicates Ethereum is stuck in a tight range and if the price breaks, then it might be a good entry point to short. The cryptocurrency has been trading inside a descending triangle for the past few sessions and is struggling to break above $1,300. ETH seems to have lost momentum as the bears are beginning to dominate the market.
At the time of writing, Ethereum is trading at $1,259.51, down by 0.84 percent in the last 24 hours. ETH is up by 3.68 percent in the last 7 days, while it has fallen by 22.34 percent in the previous month.
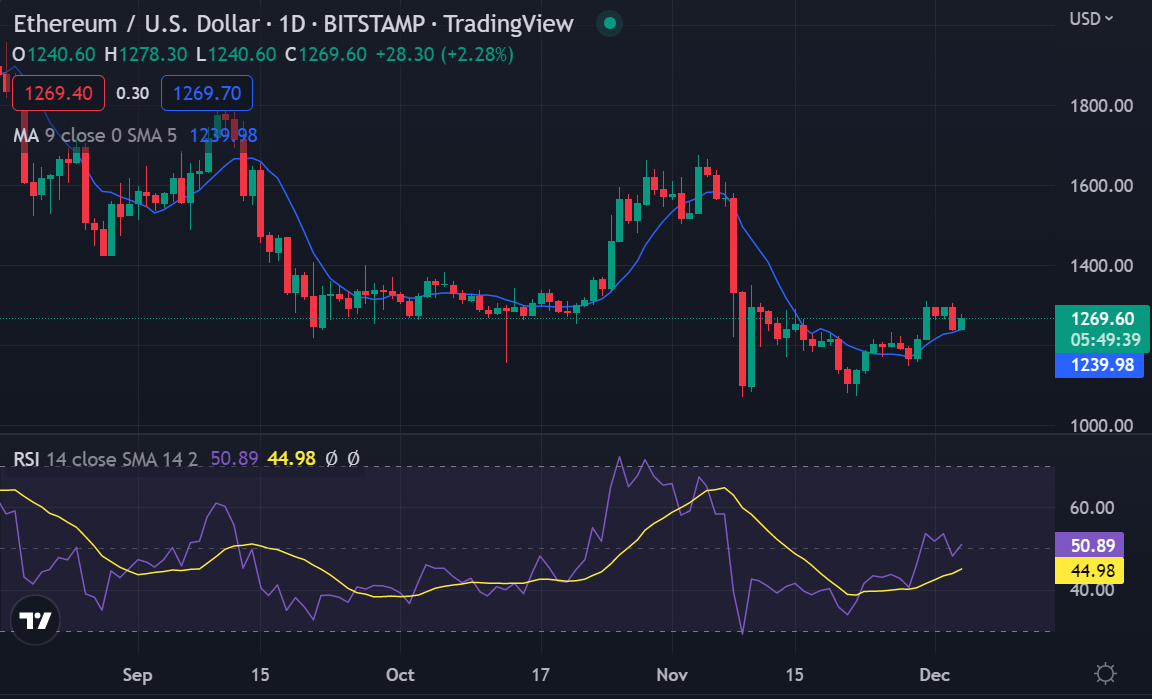
The price of Ethereum has been moving within a descending triangle for some time now, and it looks like this pattern might be broken in the coming sessions. There is a strong resistance level at $1,300 and if this level holds, then Ethereum could see a sharp decline below the triangle. ETH has been trading above $1,200 for some time now but recently it has formed lower highs indicating that there is a bearish sentiment in the market.
Ethereum price analysis on a daily chart: ETH/USD fails to break above $1,300
Ethereum price analysis on the daily chart indicates ETH has been trading inside a descending triangle pattern. ETH has been struggling to break above $1,300 for some time now and if the bulls fail to take control of the market and push the price above this level in the next session, then it could experience a sharp decline below $1,200.


The technical indicators are showing neutral to bearish sentiment in the market as both the RSI and MACD are below their respective average levels. The 100 EMA line is also below the 200 EMA, which indicates a downtrend might be imminent if Ethereum fails to break above $1,300 today.
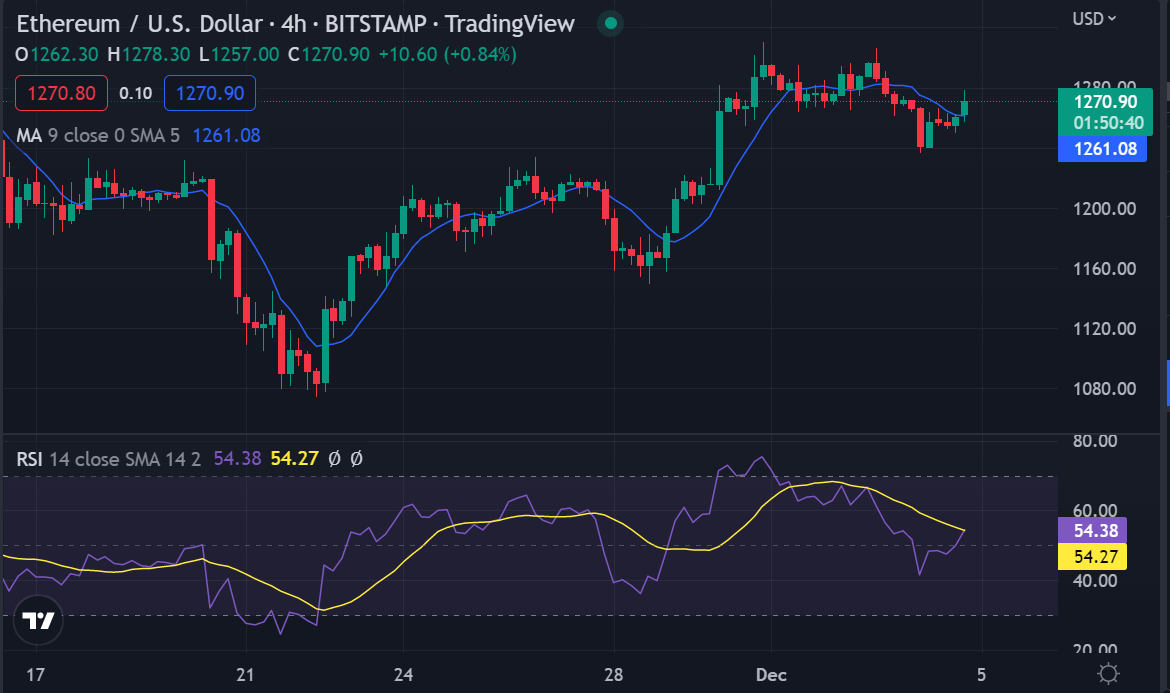
Ethereum price analysis on a 4-hour chart: Bears are beginning to dominate the market
Ethereum price analysis on the 4-hour chart indicates ETH is facing strong resistance at $1,300 and if this level fails to hold, then it could experience a sharp decline. The bears are taking control of the market as ETH has been forming lower highs for some time now.


The 4-hourly technical indicators suggest ETH could be stuck in a tight range for some time and if the price breaks below $1,200, then the bears will most likely push it lower. The 10 EMA line is also above the 20 EMA line which indicates a downtrend might be imminent.
The MACD signal line is also below the MACD histogram, which shows bearish momentum in the market. The RSI has also slipped from the overbought level to show that the bears are beginning to dominate the market.
Ethereum price analysis conclusion
Ethereum price analysis shows that ETH has been sliding down for quite some time now and it will continue to slide down if the bulls fail to push the price above $1,300. ETH has support at $1,250 and $1,200 but there is a possibility of a sharp decline below these levels in case it breaks below the triangle. The bears are slowly taking control of the market as warning signs have appeared.
While waiting for Ethereum to move further, see our Price Predictions on XDC, Cardano, and Curve.
Disclaimer. The information provided is not trading advice. Cryptopolitan.com holds no liability for any investments made based on the information provided on this page. We strongly recommend independent research and/or consultation with a qualified professional before making any investment decisions.


