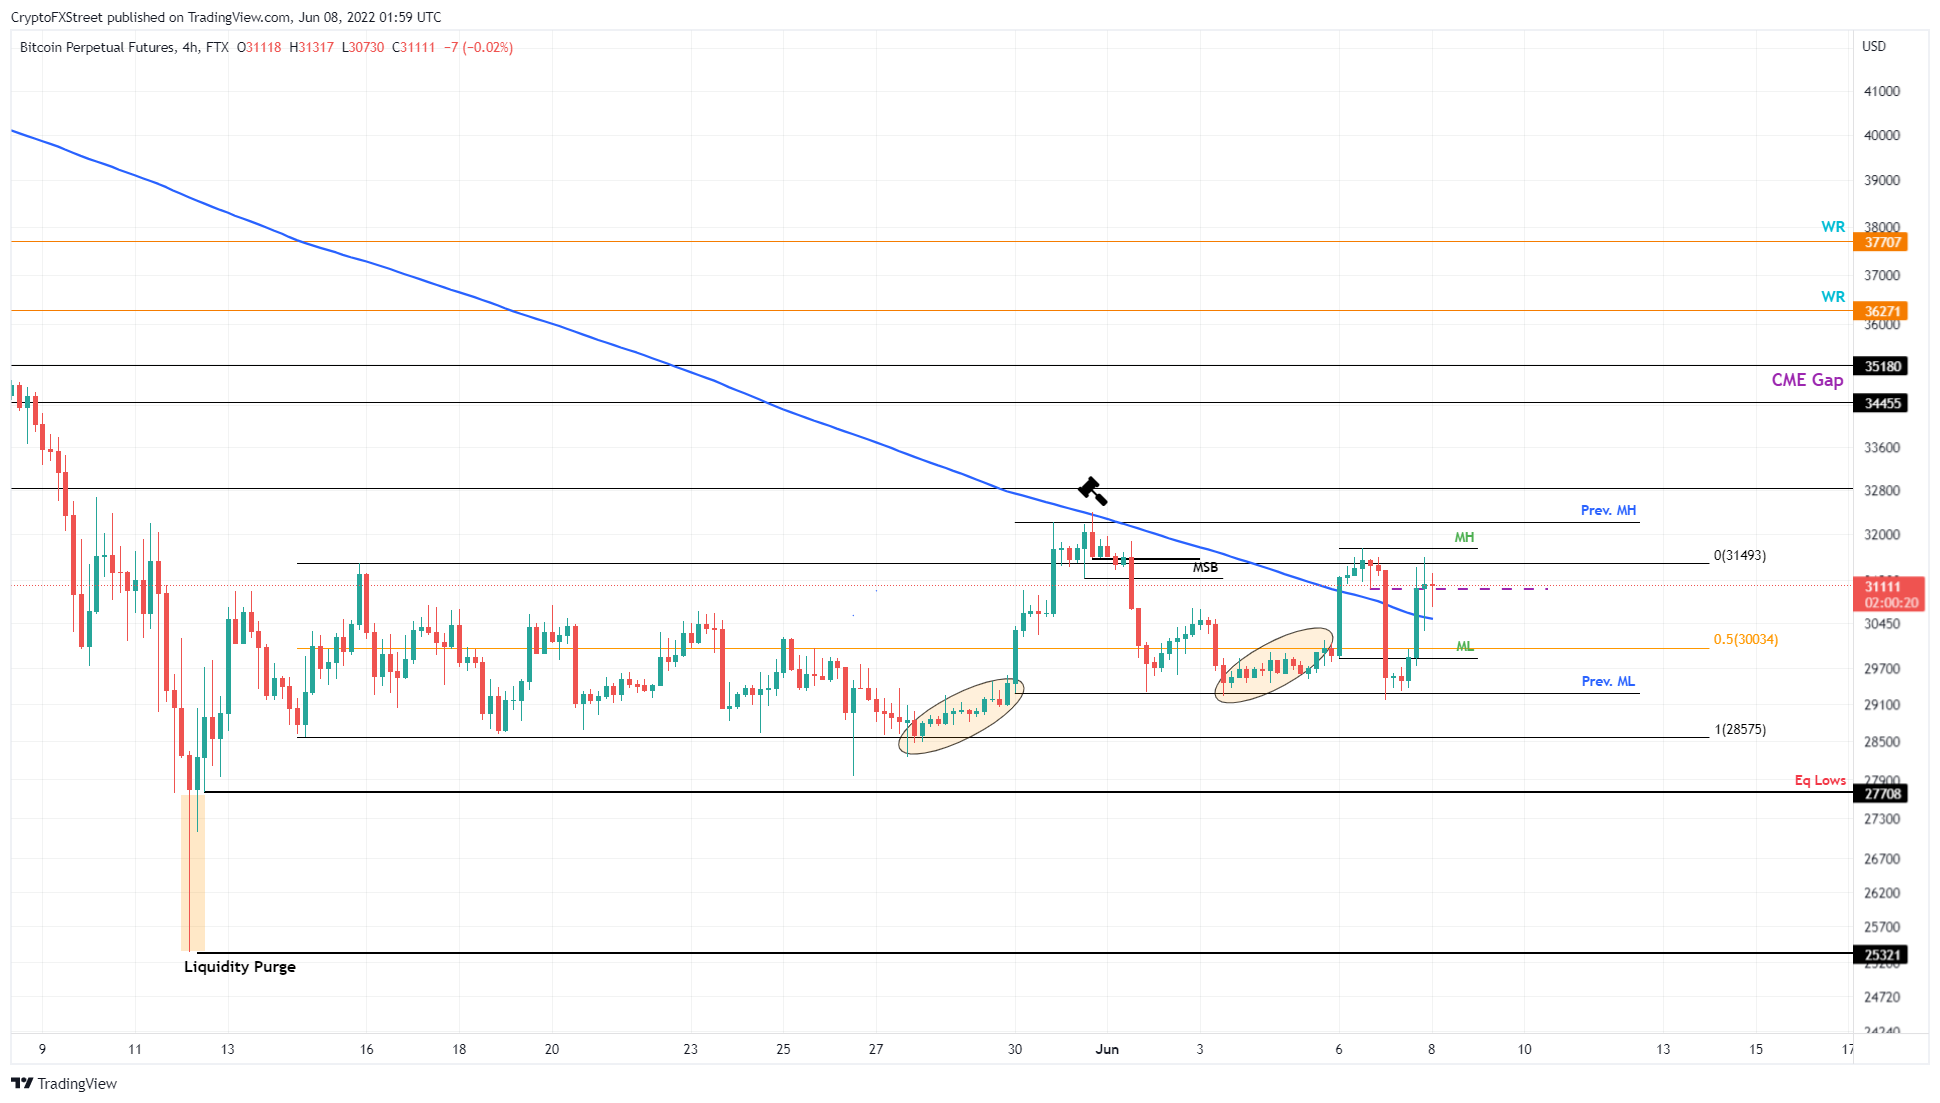
- Bitcoin price action seems like a constant pump-and-dump activity between the $28,575 and $31,493 barriers.
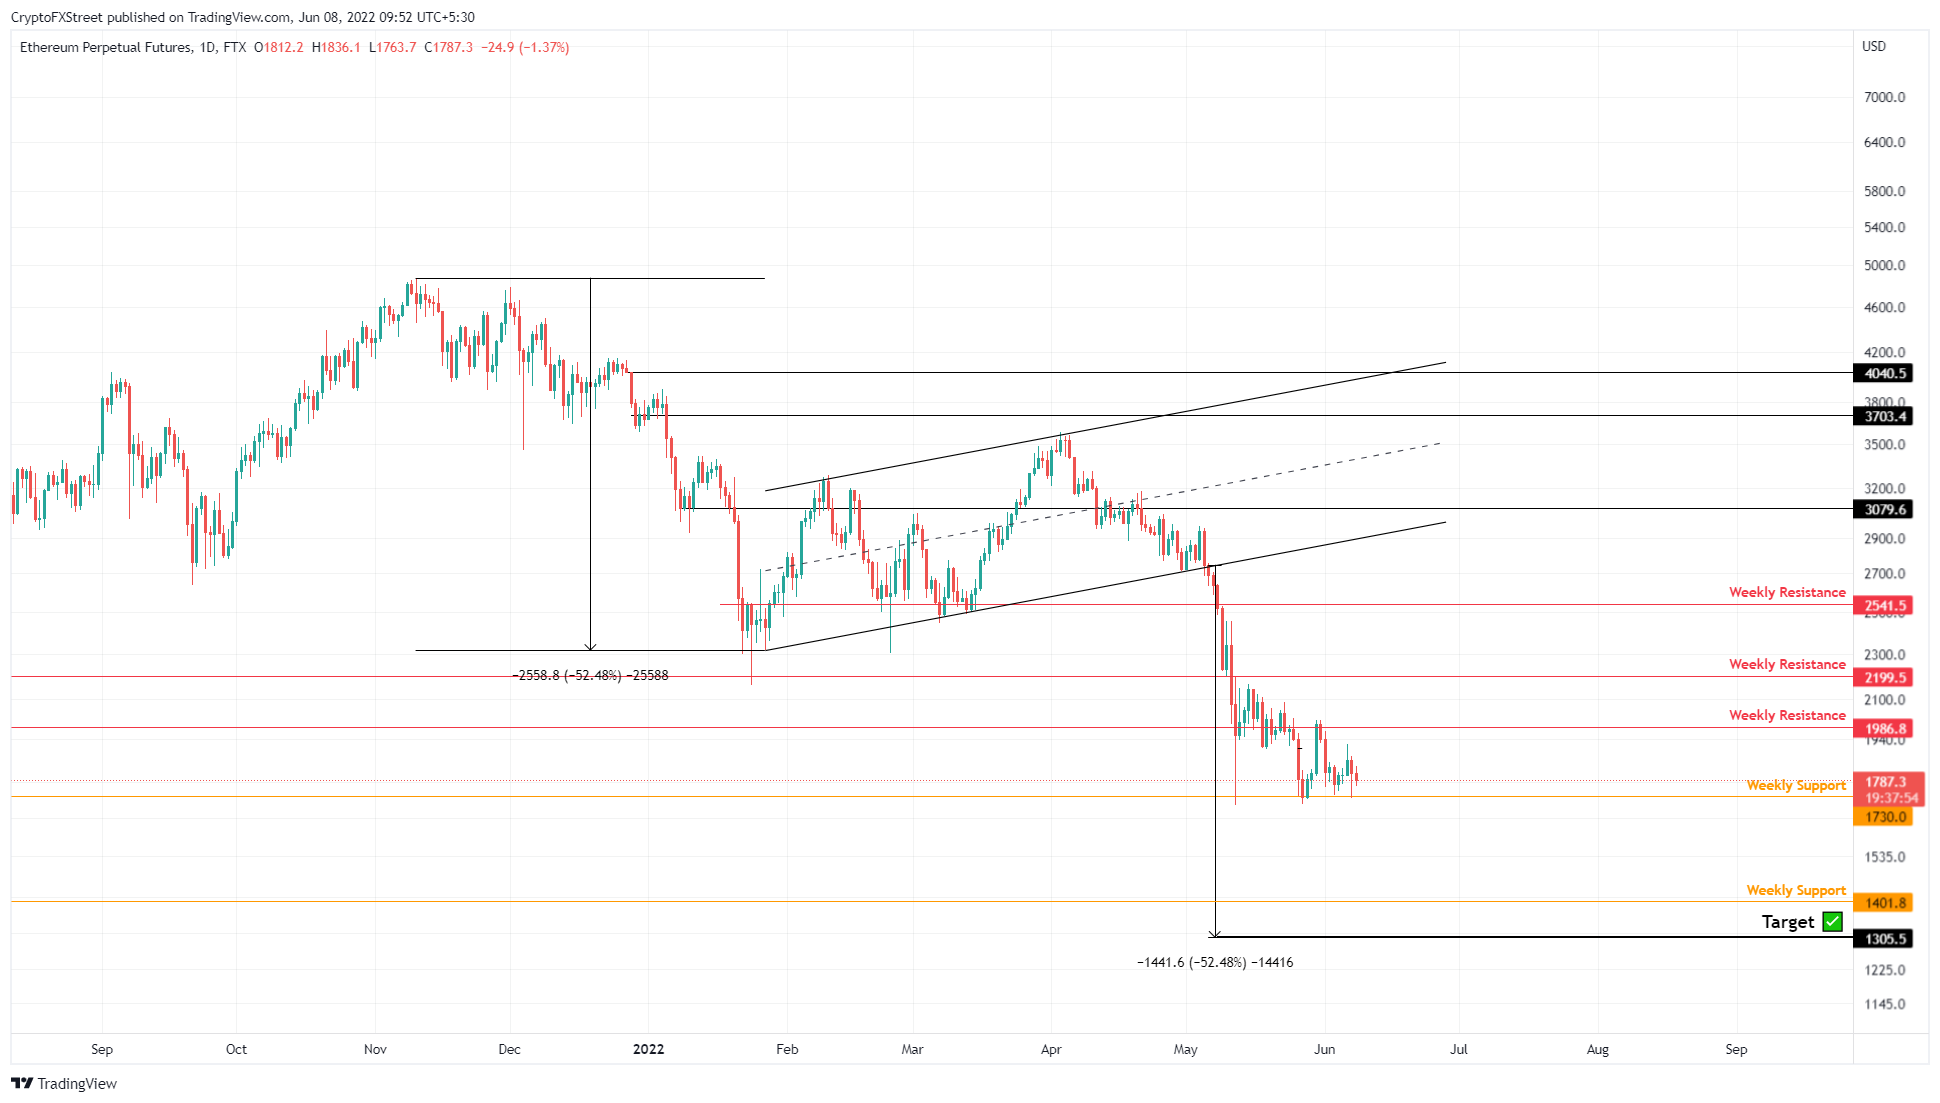
- Ethereum price continues to cook around the $1,731 support level, foreshadowing an explosive breakout to $2,164.
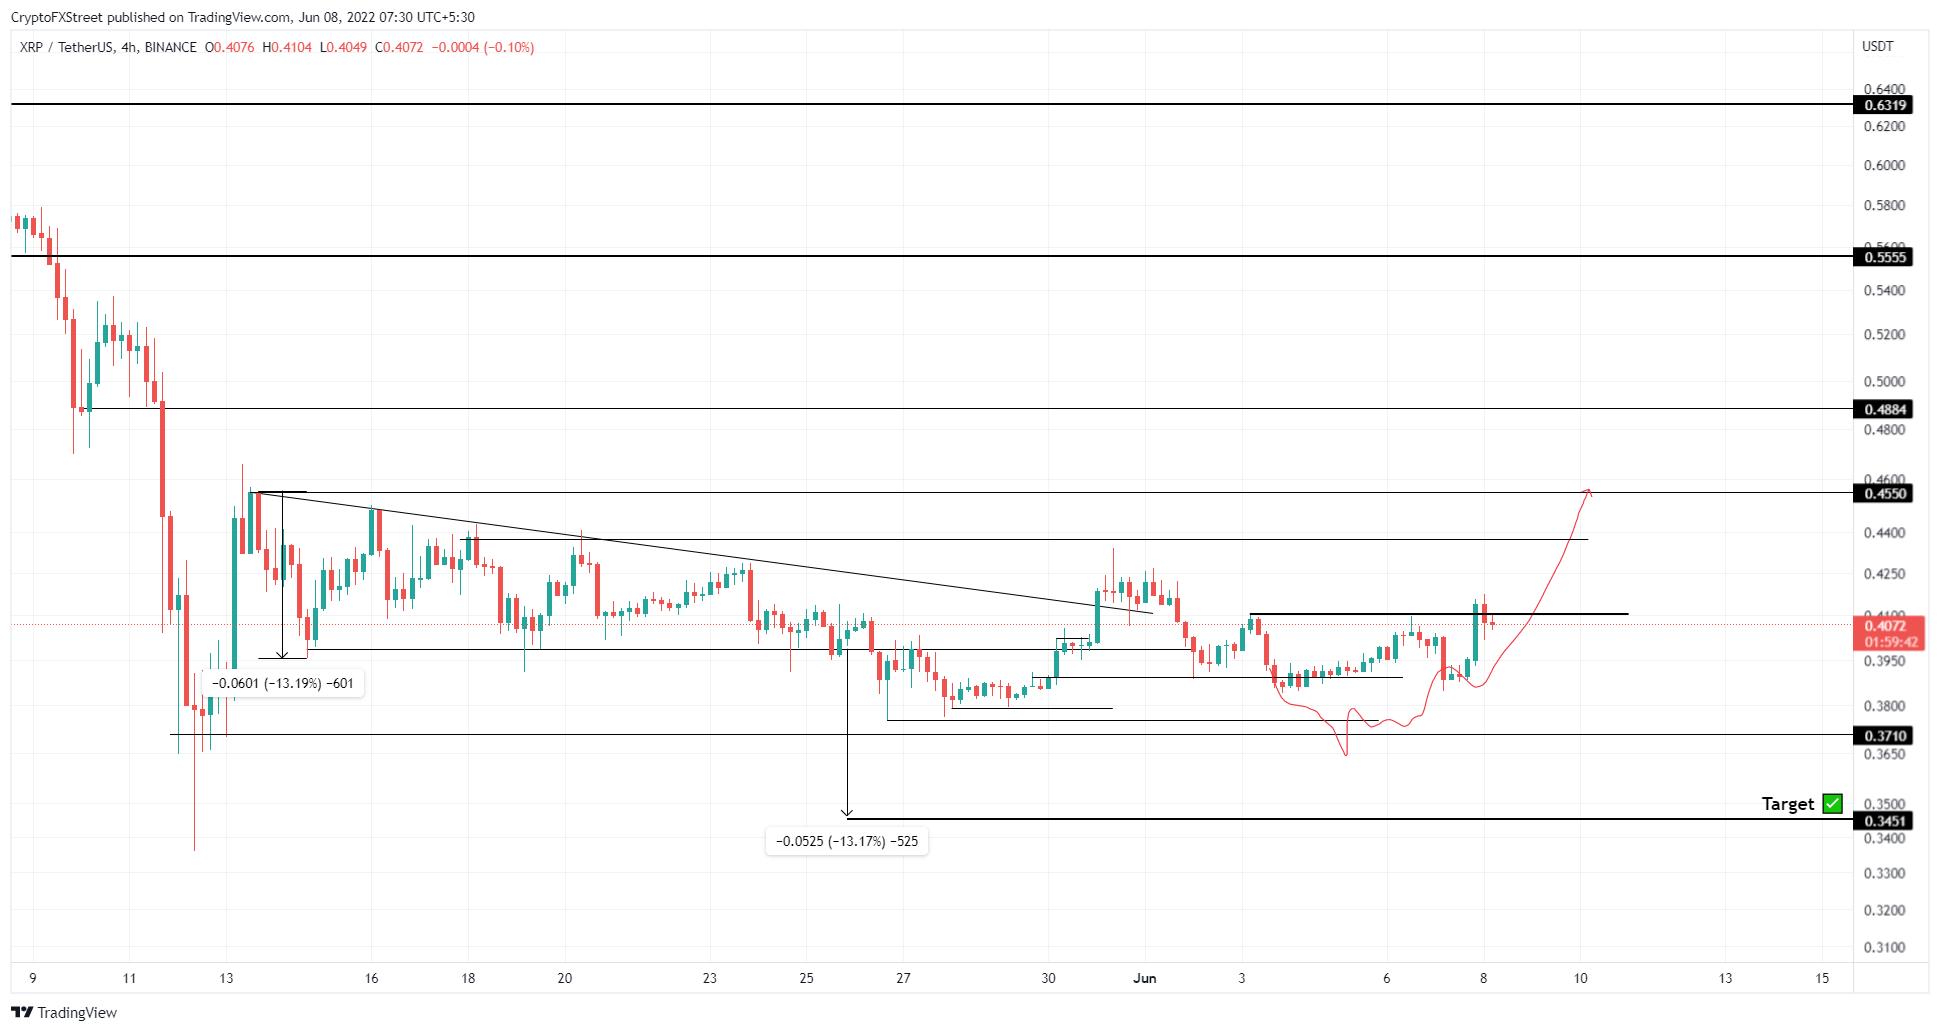
- Ripple price remains capped by minor blockades but bulls wish to retest the $0.455 hurdle.
Bitcoin price is hovering inside its range for nearly a month now and shows no signs of breaking out any time soon. However, this has not stopped investors from speculating a move higher to fill the CME gaps.
Ethereum and Ripple are both attempting to move higher but are closely correlated to the BTC price action.
Bitcoin price remains optimistic
Bitcoin price has been trading inside the $28,575 and $31,493 range since May 14. Despite the May 30 attempt to breach the stalemate, BTC fell short of momentum to break out and move higher. Regardless, the big crypto is giving it another go as it retests the range high in an attempt to flip it into a support level.
Doing so will open the path to retest the $34,455 and $35,187 hurdles with a minor hurdle at $32,837. Therefore, investors need to watch closely for a breach of the range high.
BTC/USD 4-hour chart
If Bitcoin price fails to climb higher and gets rejected by the range high at $31,493, it will dent the optimistic narrative. In such a case, BTC could potentially sweep the range low at $28,575 again.
Ethereum price remains mindful
Ethereum price has been stabilizing around the $1,731 support level for nearly two weeks and shows signs of building steam. As ETH continues to coil up, a potential spike in volatility that pushes Ethereum price to sweep the equal highs at $2,020 seems plausible.
However, in some cases, the Ethereum price could propel higher and collect the liquidity resting above the May 16 swing high at $2,164.
ETH/USD 4-hour chart
On the other hand, if Ethereum price produces a four-hour candlestick close below $1,700, it will create a lower low and invalidate the bullish thesis.
Ripple price falls back in line
Ripple price has been producing lower highs since May 13 and the recent swing high on June 8 seems to have done exactly that. As XRP price continues to trade in lockstep with Bitcoin price, this trend is likely going to continue.
While the short-term target is $0.455, the recent sell-off in BTC has caused the XRP price to follow suit. As a result, investors need to be patient and re-evaluate as Ripple price slides lower to tag the $0.371 support level.
XRP/USD 4-hour chart
While things are looking up for Ripple price, a breakdown of the $0.371 support barrier will invalidate the bullish thesis. Such a development could further lead to a 7% crash to $0.345.


